Dataset Details
Overview
Three StudentLife datasets are associated with studying undergraduates at Dartmouth College.
First StudentLife Study: The first dataset is from the 2013 StudentLife study, with results published in a landmark ACM UbiComp 2014 paper presented by Rui Wang (now at Meta). This dataset captures 48 undergraduate students over a single 10-week term using Android phones. For the first time, it reveals the day-to-day and week-by-week impact of workload on stress, sleep, activity, mood, sociability, mental well-being, and academic performance. A second paper presented at ACM UbiComp 2015 by Rui Wang on academic performance from the same study predicted GPA within ±0.179 of the reported grades. We talk about this dataset in detail below.
Second StudentLife Study: The second study followed 83 undergraduate students over two consecutive terms in 2016, utilizing smartphones and wearables to investigate the dynamics of depression and anxiety. Andrew Campbell presented the results in an ACM UbiComp 2018 paper, demonstrating that symptom features derived from phone and wearable sensors predict whether a student is depressed on a week-by-week basis with 81.5% recall and 69.1% precision. This dataset will be released this academic year.
Third StudentLife Study: The third study tracked over 200 undergraduate students from high school to graduation, providing invaluable insights into changing behaviors, resilience, and mental health in college life. Passive sensor data, surveys, and interviews were used to capture changing behaviors before, during, and after the COVID-19 pandemic subsided. The paper from this study will be presented at ACM UbiComp 2024. Other papers have been published using the dataset, including 1) an ACM UbiComp 2022 paper on the mental health of first-generation undergraduate students presented by Weichen Wang; 2) an ACM CHI 2022 paper comparing students' behavioral changes from the year before COVID-19 against the first year of COVID-19 presented by Subigya Nepal; 3) an ACM UbiComp 2020 paper on predicting brain functional connectivity from fMRI brain-imaging data and mobile behavioral sensing data presented by Mikio Obuchi; and 4) a Journal of Medical Internet Research paper on the early months of the COVID-19 pandemic. This dataset comprises fMRI brain-imaging, mobile sensing, EMA, and surveys. It is available for download on Kaggle.
Introduction
The StudentLife dataset is a large, longitudinal dataset that is rich in formation and deep. Importantly, the dataset is anonymized protecting the privacy of the participants in the study.
The dataset is from 48 undergrads and grad students at Dartmouth over the 10 week spring term. It includes over 53 GB of continuous data, 32,000 self-reports, and pre-post surveys; specifically it comprises:
- objective sensing data: sleep (bedtime, duration, wake up); conservation duration, conversation frequency; physical activity (stationary, walk, run);
- location-based data: location, co-location, indoor and outdoor mobility;
- other phone data: light, Bluetooth, audio, Wi-Fi, screen lock/unlock, phone charge, app usage.
- self-reports: affect (PAM), stress, behavior, Boston bombing reaction, cancelled classes, class opinion, comment, Dartmouth now, Dimension incident, Dimension protest, dining halls, events, exercise, Green Key, lab, mood, loneliness, social and study spaces.
- pre-post surveys: PHQ9 depression scale, UCLA loneliness scale, positive and negative affect schedule (PANAS), perceived stress scale (PSS), big five personality, flourishing scale, Pittsburgh sleep quality index, veterans RAND 12 item health (VR12)
- academic performance data: class information, deadlines, grades (grades, term GPA, cumulative GPA), piazza data
- dinning data: meals data, location and time
- seating data: seating position of students in Android programming
- entry and exit surveys: to be added once anonymized
The whole StudentLife dataset is in one big file: full dataset, which contains all the sensor data, EMA data, survey responses and educational data.
For privacy considerations, we removed data that may reveal participants' identities. For example, Bluetooth devices' names may contain participants' real name because people use their names to name their computers. Browser logs are also removed from the dataset. WiFi AP's SSID has beed removed from the dataset because Dartmouth College Network Service does not allow us to disclose any information on campus WiFi AP deployment.
We recommend importing the whole dataset into a centralized datastore (e.g. MongoDB, Apache Cassandra) first. It will make the data processing much easier.
Citation
Please cite the following paper if the dataset is used in a publication:
Wang, Rui, Fanglin Chen, Zhenyu Chen, Tianxing Li, Gabriella Harari, Stefanie Tignor, Xia Zhou, Dror Ben-Zeev, and Andrew T. Campbell. "StudentLife: Assessing Mental Health, Academic Performance and Behavioral Trends of College Students using Smartphones." In Proceedings of the ACM Conference on Ubiquitous Computing. 2014.
R package
Tidy handling and navigation of the valuable Student-Life mHealth dataset: https://github.com/frycast/studentlifeFryer, Daniel, Hien Nguyen, and Pierre Orban. "studentlife: Tidy Handling and Navigation of a Valuable Mobile-Health Dataset." [pdf]
Data Directory Organization
The dataset directories are organized by data types. StudentLife dataset contains four types of data: sensor data, EMA data, pre and post survey responses and educational data. The top level directory is shown below. In the following subsections, we introduce the structure of each directory, and the data format in next section.
   dataset
   |-user_info.csv
   |-sensing
   |-EMA
   |-education
   |-survey
Sensor Data
There are 10 subdirectories in dataset/sensing that correspond to 10 different sensor data: physical activity, audio inferences, conversation inferences, Bluetooth scan, light sensor, GPS, phone charge, phone lock, WiFi, WiFi location. All sensor data is stored in csv files.
The data files under each data type subdirectory are organized by participants. For example, you can find all physical activity inferences for u01 in sensing/activity/activity_u01.csv. Similarly, you can find u01's conversation inferences in sensing/conversation/conversation_u01.csv.
   sensing
   |-activity
   |-audio
   |-conversation
   |-bluetooth
   |-dark
   |-gps
   |-phonecharge
   |-phonelock
   |-wifi
   |-wifi_location
EMA Data
You can find EMA question definitions in EMA/EMA_definition.json. Participants' responses are stored in EMA/responses. The name of subdirectories under EMA/responses correspond to EMA question's name. For example, EMA/responses/Stress contains all participants' responses to the Stress EMA. Similar to sensor data, each EMA's responses are organized by participants' uid. You can find detailed EMA file format in EMA section
   EMA
   |-EMA_definition.json
   |-response
   |---Activity
   |---Administration's response
   |---Behavior
   |---Boston Bombing
   |---Cancelled Classes
   |---Class
   |---Class 2
   |---Comment
   |---Dartmouth now
   |---Dimensions
   |---Dimensions protestors
   |---Dining Halls
   |---Do Campbell's jokes suck?
   |---Events
   |---Exercise
   |---Green Key 1
   |---Green Key 2
   |---Lab
   |---Mood
   |---Mood 1
   |---Mood 2
   |---PAM
   |---Sleep
   |---Social
   |---Stress
   |---Study Spaces
Pre and Post Surveys
All pre and post survey responses are stored in corresponding files under dataset/survey. The directory is organized by survey names. For example, you can find participants' pre and post responses to PHQ-9 depression scale in survey/PHQ-9.csv. All files are in csv format, which is defined in Survey section.
   survey
   |---BigFive.csv
   |---FlourishingScale.csv
   |---LonelinessScale.csv
   |---panas.csv
   |---PerceivedStressScale.csv
   |---PHQ-9.csv
   |---psqi.csv
   |---vr_12.csv
Educational Data
Educational data, which include classes taken during 2013 Spring term, deadlines for each participants, grades and Piazza usage for CS65, is stored under dataset/education. Detailed description is in Educational Data section.
   education
   |---class_info.json
   |---class.csv
   |---deadlines.csv
   |---grades.csv
   |---piazza.csv
Automatic Sensing
This section introduces the data format of automatic sensor data that resides under dataset/sensing.
Physical Activity Inferences
The first few lines of a participant's physical activity inferences file look like this:
| timestamp | activity inference |
|---|---|
| 1364356853 | 0 |
| 1364356856 | 0 |
| 1364356858 | 0 |
The first row is the header row, which defines that there are two fields in activity data files: timestamp and activity inference id. The timestamp is the Unix time when the inference was collected. The timezone is Eastern Time Zone.
The activity classifier runs 24/7 with duty cycling. To avoid draining the battery, it makes activity inferences continuously for 1 minutes, then pause for 3 minutes before restart collecting activity inferences again. It generates one activity inference every 2~3 seconds depending on smartphone's accelerometer sampling rate. The meaning of activity inference is described in the following table.
| Inference ID | Description |
|---|---|
| 0 | Stationary |
| 1 | Walking |
| 2 | Running |
| 3 | Unknown |
Audio
The first few lines of a participant's physical audio inferences file look like this:
| timestamp | audio inference |
|---|---|
| 1364356875 | 0 |
| 1364356876 | 0 |
| 1364356877 | 0 |
The first row is the header row, which defines that there are two fields in audio data files: timestamp and audio inference type id. The timestamp is the Unix time when the inference was collected. The timezone is Eastern Time Zone.
The audio classifier runs 24/7 with duty cycling. It makes audio inferences for 1 minutes, then pause for 3 minutes before restart. If the conversation classifier detects that there is a conversation going on, it will keep running until the conversation is finished. It generates one audio inference every 2~3 seconds. The meaning of audio inference is described in the following table.
| Inference ID | Description |
|---|---|
| 0 | Silence |
| 1 | Voice |
| 2 | Noise |
| 3 | Unknown |
Conversation
The first few lines of a participant's conversation inferences file look like this:
| start_timestamp | end_timestamp |
|---|---|
| 1364425656 | 1364425727 |
| 1364427639 | 1364427780 |
| 1364428051 | 1364428485 |
There are two fields in conversation data files: conversation start timestamp and conversation end timestamp. For example, the first row in showing above records that the participant was around a conversation from Unix timestamp 1364425656 to Unix time stamp 1364425727. The timezone is Eastern Time Zone.
GPS Location
The first few lines of a participant's GPS location file look like this:
| time | provider | network_type | accuracy | latitude | longitude | altitude | bearing | speed | travelstate |
|---|---|---|---|---|---|---|---|---|---|
| 1364357009 | network | wifi | 67.993 | 43.7066671 | -72.2890974 | 0.0 | 0.0 | 0.0 | stationary |
| 1364358209 | network | wifi | 23.0 | 43.706637 | -72.2890664 | 0.0 | 0.0 | 0.0 | moving |
| 1364359405 | gps | 16.0 | 43.70667831 | -72.28901794 | 136.300003052 | 96.2 | 0.25 |
GPS coordinates were collected every 10 minutes. Important data fields are shown as follows:
| Field Name | Description |
|---|---|
| time | The Unix time of when it was collected (EST) |
| provider | The source of GPS coordinates: GPS or network |
| network_type | Which network was used to obtain GPS fix when the provider is network |
| latitude | Latitude |
| longitude | Longitude |
Bluetooth
The first few lines of a participant's Bluetooth scan log file look like this:
| time | MAC | class_id | level |
|---|---|---|---|
| 1364359421 | 00:26:08:C9:80:E2 | 3670284 | -79 |
| 1364359421 | 68:A8:6D:24:D9:8F | 3801356 | -92 |
| 1364360622 | 68:A8:6D:24:D9:8F | 3801356 | -94 |
| 1364388221 | 00:26:08:D2:B5:E9 | 3670284 | -80 |
| 1364393027 | 00:26:08:B8:D2:CF | 3801356 | -86 |
| 1364393027 | 44:2A:60:FB:B7:59 | 3801356 | -93 |
Bluetooth scans every 10 minutes. We removed device names for privacy concerns. Important data fields are shown as follows:
| Field Name | Description |
|---|---|
| time | The Unix time of when it was collected |
| MAC | The MAC address of surrounding Bluetooth device |
| class_id | Describes general characteristics and capabilities of a device, see android.bluetooth.BluetoothClass |
| level | Signal strength |
Note: rows that share same timestamp belong to a single Bluetooth scan.
WiFi
The first few lines of a participant's WiFi AP scan log file look like this:
| time | BSSID | freq | level |
|---|---|---|---|
| 1364356944 | d0:57:4c:57:58:00 | 2437 | -68 |
| 1364356944 | dc:7b:94:87:29:b0 | 2462 | -87 |
| 1364357187 | d0:57:4c:57:58:00 | 2437 | -68 |
| 1364357187 | dc:7b:94:87:29:b0 | 2462 | -87 |
| 1364357514 | d0:57:4c:57:58:00 | 2437 | -68 |
| 1364357514 | dc:7b:94:87:46:f2 | 2412 | -89 |
WiFi scans frequently. We removed SSID for privacy concerns. Important data fields are shown as follows:
| Field Name | Description |
|---|---|
| time | The Unix time of when it was collected |
| BSSID | AP's MAC address |
| freq | AP's working channel frequency |
| level | Signal strength |
Note: rows that share same timestamp belong to a single WiFi scan.
WiFi Location
We acquired Dartmouth College's WiFi AP deployment information from Dartmouth Network Services which allows us to calculate a participant's on-campus rough location. However, we are not allowed to release Dartmouth WiFi AP deployment information to the public, so we release the location inference we calculated based on participants' WiFi scan log. You can use location inferred from WiFi scan and GPS Location data to infer the GPS coordinates of each Dartmouth building.
The first few lines of a participant's WiFi location file look like this:
| time | location |
|---|---|
| 1364357009 | near[north-main; cutter-north; kemeny; ] |
| 1364358209 | in[kemeny] |
| 1364359102 | in[kemeny] |
| 1364359163 | in[kemeny] |
| 1364359223 | in[kemeny] |
| 1364359409 | in[kemeny] |
| 1364359508 | near[kemeny; cutter-north; north-main; ] |
| 1364359793 | near[kemeny; cutter-north; north-main; ] |
| 1364360078 | near[kemeny; cutter-north; north-main; ] |
Each field is defined as follows:
| Field Name | Description |
|---|---|
| time | The Unix time of when it was collected |
| location | On-campus location inferred from WiFi scans. |
There are two kinds of location inferences: in a building (e.g. in[kemeny]) and near some buildings (near[kemeny; cutter-north; north-main;]).
Light
The light data files record when the phone was at a dark environment for a significant long time (>=1 hour). There are two fields in each data file: start timestamp and end timestamp.
The first few lines of a participant's light sensor file look like this:
| start | end |
|---|---|
| 1364359112 | 1364387807 |
| 1364397153 | 1364400889 |
| 1364402955 | 1364418088 |
| 1364423980 | 1364432230 |
Phone Lock
The phone lock data files record when the phone was locked for a significant long time (>=1 hour). There are two fields in each data file: start timestamp and end timestamp.
The first few lines of a participant's phone lock file look like this:
| start | end |
|---|---|
| 1364359161 | 1364387080 |
| 1364395185 | 1364402754 |
| 1364402806 | 1364409439 |
| 1364427062 | 1364432230 |
Phone Charge
The phone charge data files record when the phone was plugged in and charging for a significant long time (>=1 hour). There are two fields in each data file: start timestamp and end timestamp.
The first few lines of a participant's phone charge file look like this:
| start | end |
|---|---|
| 1364359041 | 1364387080 |
| 1364531150 | 1364560331 |
| 1364622533 | 1364657458 |
| 1364703563 | 1364739262 |
EMA
EMA data has two parts: EMA question definitions and participants' responses.
EMA Definitions
EMA question definition is defined in dataset/EMA/EMA_definition.json. It defines a JSON array that stores all EMA questions' definitions. For example, the Sleep EMA question is defined as follows:
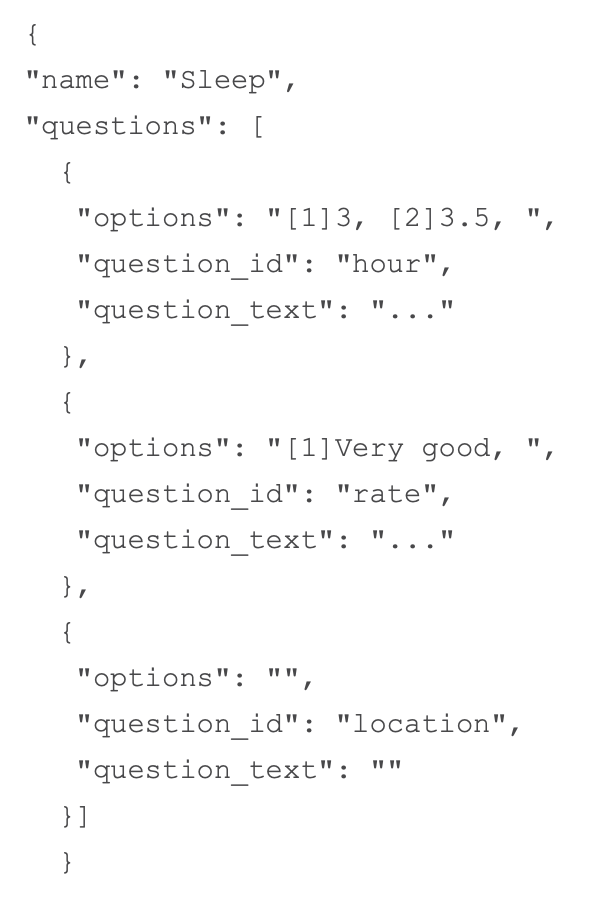
The name field defines the EMA question's name (i.e. Sleep in the above example). The questions field defines the questions that the participants need to answer for this EMA. Each item in questions array has three fields: question_text, question_id and options. question_text is the text of the question. question_id is the id of the question. options defines candidates of the response. For example, if a participant answered 6.5 for the first Sleep EMA question "How many hours did you sleep last night?", you will find hour:8 in their corresponding response record.
EMA Responses
EMA responses are in JSON array format. Each item in the JSON array is one response. As mentioned in EMA Definitions, the keys of each response are EMA question names defined in the EMA definitions. The value is participant's response to the question. It corresponds to the index of the options defined in the EMA definitions.
One Sleep EMA response looks like below:
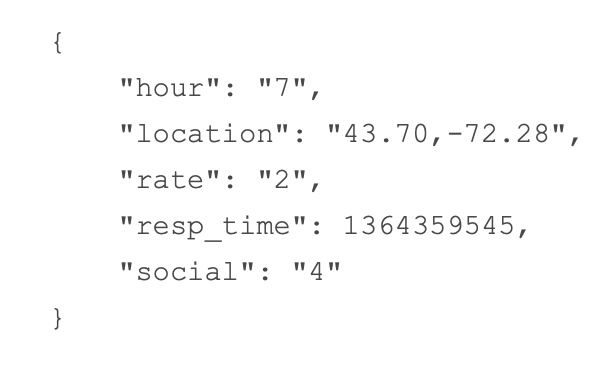
We can learn from this response that the participants responded at Unix time 1364359545 (EST), and the participants' location GPS coordinates is 43.70705013,-72.28730277 when he/she was answering the EMA question. The participant slept 6 hours according to the hour field. His/her sleep quality was Fairly good and he/she had Three or more times to have trouble staying awake yesterday while in class, eating meals or engaging in social activity according to rate and social respectively.
Seating Position
You can seating position data files under the folder dataset/EMA/response/QR_Code. There are two fields in each seating position data file: timestamp and a QR code corresponding to a seating position.
The mapping between the seating position and the QR code is as follows:
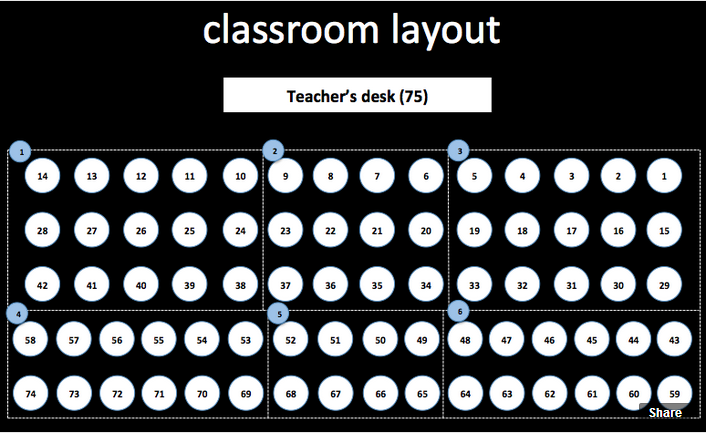
Seating Position Mapping
Survey Responses
Survey responses file contains participants's responses to both pre and post mental health measures. The following shows u01's pre and post responses to the Flourishing Scale. The first column shows which participants answered the survey and the second column indicates if the response is from pre or post measurement. The rest columns correspond to each survey questions.
| uid | type | I lead a purposeful and meaningful life | My social relationships are supportive and rewarding | I am engaged and interested in my daily activities | I actively contribute to the happiness and well-being of others | I am competent and capable in the activities that are important to me | I am a good person and live a good life |
|---|---|---|---|---|---|---|---|
| u01 | pre | 4 | 6 | 6 | 6 | 7 | 6 |
| u01 | post | 5 | 5 | 6 | 5 | 7 | 6 |
You can find detailed information about the mental health surveys from the following references:
- Spitzer R., Kroenke, K., Williams, J. (1999). Validation and utility of a self-report Version of PRIME-MD: the PHQ Primary Care Study. Journal of the American Medical Association, 282, 1737-1744.
- Kroenke K, Spitzer R L, Williams J B (2001). The PHQ-9: validity of a brief depression severity measure. Journal of General Internal Medicine, 16(9): 606-613.
- Russell, Daniel W. "UCLA Loneliness Scale (Version 3): Reliability, validity, and factor structure." Journal of personality assessment 66.1 (1996): 20-40.
- Mount, Michael K., and Murray R. Barrick. "The Big Five personality dimensions: Implications for research and practice in human resources management." Research in personnel and human resources management 13.3 (1995): 153-200.
- Most, Robert, and Theresa Muñoz. "Perceived Stress Scale."
- Diener, E., Wirtz, D., Tov, W., Kim-Prieto, C., Choi, D., Oishi, S., & Biswas-Diener, R. (2010). New measures of well-being: Flourishing and positive and negative feelings. Social Indicators Research, 39, 247-266.
- The Veterans RAND 12 Item Health Survey (VR12): What is it and How it is Used (2009) Iqbal SU, Rogers W, Selim A, Qian S, Lee A, Ren XS, Rothendler J, Miller D, Kazis LE Center for Health Quality, Outcomes, and Economic Research, A Health Services Research and Development Center of Excellence, VA Medical Center, Bedford, MA, USA
- Buysse, Daniel J., et al. "Quantification of subjective sleep quality in healthy elderly men and women using the Pittsburgh Sleep Quality Index (PSQI)." Sleep: Journal of Sleep Research & Sleep Medicine (1991).
- Watson, David, Lee A. Clark, and Auke Tellegen. "Development and validation of brief measures of positive and negative affect: the PANAS scales." Journal of personality and social psychology 54.6 (1988): 1063.
Education
There are four types of educational data: classes which participants took during the 2013 Spring term, number of class deadlines per day, GPA and Piazza usage.
Class
class.csv records classes which participants took during the 2013 Spring term.
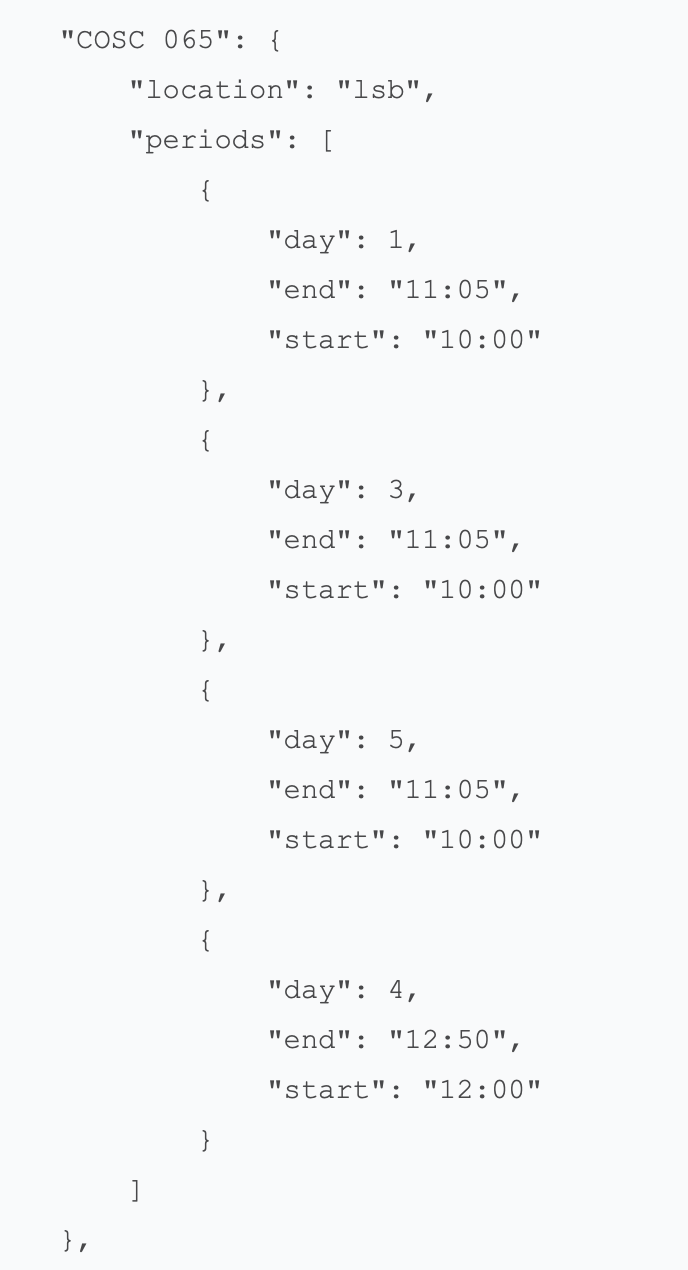
You can find the lecture time period and location in class_info.json. All classes are stored in a JSON array. The following shows the location and class periods for COSC 065. The class location corresponds to the WiFi location. The periods defines all class meeting periods in an JSON array. day is the weekday that the lecture takes place where Monday is 1 and Friday is 5.
GPA
You can find participants' cumulated GPA, 2013 Spring term GPA and grades for COSC 065 in grades.csv
Class Deadlines
deadline.csv records the number of class deadlines for each participant from March 27, 2013 to June 5, 2013. Class deadlines include homework deadlines, projects, quiz, mid-terms and finals.
Piazza Usage
piazza.csv contains participants' Piazza usage data. The definition of each column is as follows.
| Field Name | Description |
|---|---|
| days online | number of days the student logged in CS65 Piazza class page |
| views | number of posts the student has viewed |
| contribution | number of posts, responses, edits, followups, and comments to followups (i.e., everything) |
| questions | number of questions the student has asked |
| notes | number of notes the student has posted |
| answers | number of questions the student has answered |
Please refer to Piazza.com for more detail information.
Other Datasets
- CrossCheck Dataset: Available on Kaggle
- College Experience Study Dataset: Available on Kaggle
Note: The StudentLife study dataset is also available on Kaggle here.